
Infographics make information visually stunning while seeking to deliver a tremendous amount of information quickly, and their popularity has grown over the years. Today, brands and businesses use infographics to bring more traffic and nurture credibility in general audiences’ eyes.
Besides, infographics offer you a terrific method to cover heavy topics and yet make them enjoyable for the audiences. We all know that while facts and figures lend authority to your message, the visuals make your content more appealing.
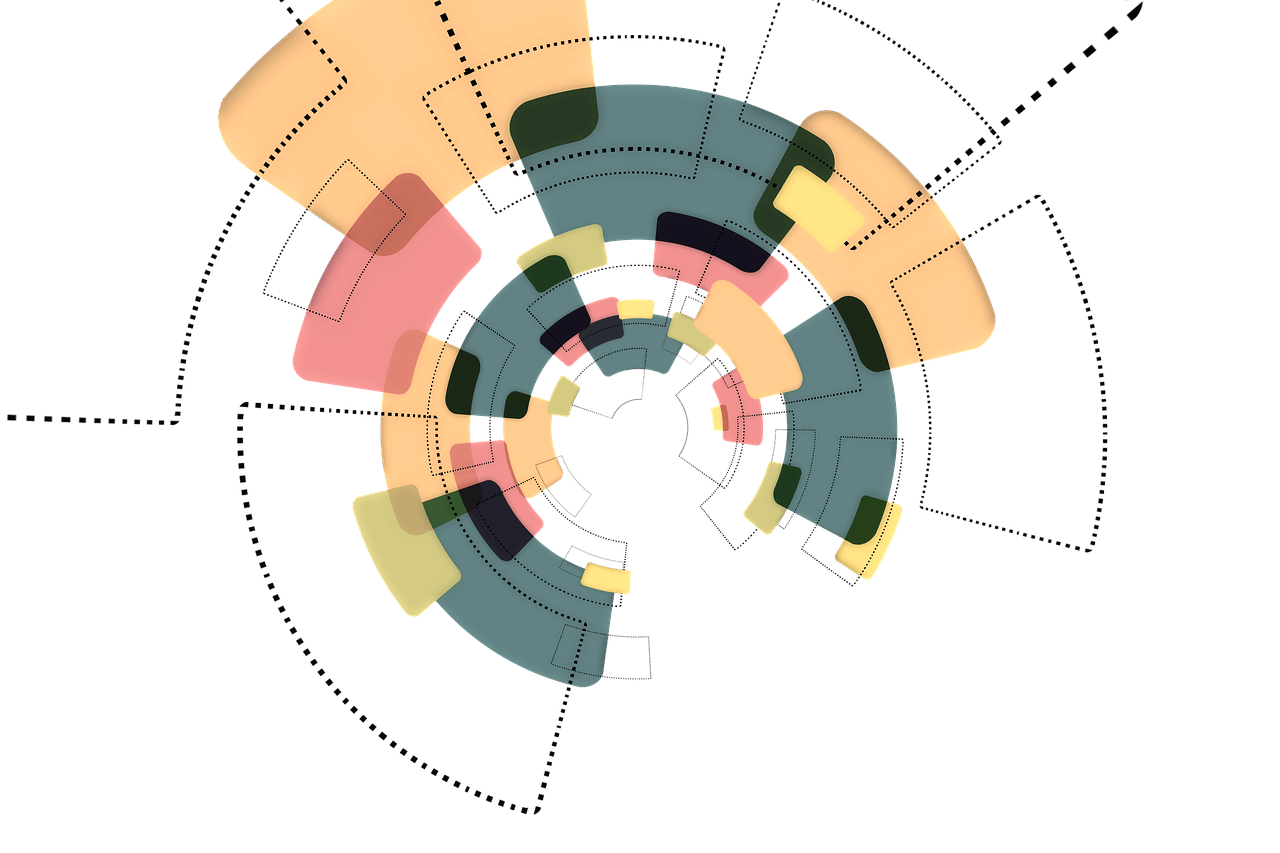
According to a recent study by Visme, colors in visuals increase the attention span in viewers by 82%, while messages in color are 39% more likely to be remembered.
Moreover, it has been found that instructions with visuals create a 15% increase in productivity, while 30% of people are more likely to send payment faster when prompted by visuals.
Furthermore, people remember 65% of the information they see and only 10% of the information they hear out loud.
In light of this information, let’s take a quick look at how businesses can make a perfect infographic that is effective with SEO.
Appropriate Keyword Research & Implementation
If you want your infographic to impact your SEO, proper keyword research and implementation would definitely matter. For any keyword research, the target market is extremely important and understands what terms are they searching for.
You can utilize a keyword research tool to help you discover the average monthly search volumes of important keywords along with similar keywords. Some of the best keyword research tools include the likes of Ahrefs, Google Keyword Planner, SEMrush SEO tool suite, and Long Tail Pro, to name a few. On the other hand, some f the best places to put your keywords include:
- Meta title and Meta description of the page where your infographic is displayed.
- The H1 heading, as well as any other relevant headings on the page.
- The image file for the infographic should also include the keyword in the file name.
- You can also add image alt text where you can put the keyword.
- Additionally, you can add a decent word count to write a prelude and both the conclusion to your infographic where you can include keywords.
Compelling Intro
To make your infographic look and feel more professional, it is always best to offer viewers brief info or an introduction about the infographic. Here you can introduce the topic or the subject which your infographic will cover in detail. You can also point out important findings, your research methodology, or the special thanks to contributing partners/sources. Plus, with the extra word count to spare, the intro, as mentioned above, is a great place to add your thoroughly researched keywords.
Embed Code
 Embed code for your infographic makes it extremely easy for people to share your infographic. It is only natural that the more people share your infographic, the more popular it becomes. The more popular it becomes, and search engines will start picking up on it.
This is where embedded code comes into play. By offering your viewers the embedded code to your infographic, they easily share your visual content. There is plenty of embedded code generators online, including the likes of Siege Media. Here is what you need to know:
- Upload the full resolution file of your infographic and add the link to your blog.
- Site name refers to the URL that you want people who embed your infographic to attribute.
- Post URL, on the other hand, is where your infographic actually lives on your site.
- Image URL is where the full resolution file can be found on your site.
- Image Alt describes the alt text of your infographic.
- The image dimensions, including the width and height of the image
- Embed box dimensions, determine how the embed code looks on your webpage or on your blog post.
Focus on Link Building
Infographics can also be used to promote and build links, which can greatly help boost your SEO.
Here is what you can do:
- Create, develop, and publish your infographic.
- After researching your topic and studying your target audience, share your infographic across various platforms.
- You can further promote your infographic by writing a post about it or sharing it through social media.
- Furthermore, you can also reach out to bloggers or influencers who would be interested in your topic or subject.
- It would be best if you also considered sending your infographic to heap loads of infographic directories that you can find online.
- You can also broadcast your infographic by sharing it in email or including in other relevant content formats such as press releases, newsletter, and much more.
Students who opt for cheap essay writing service UK and looking forward to a bright future as an SEO specialist should brush up on their link building skills early on.
Improve Loading Times
While improving SEO through your infographic is pretty much possible, you should also consider improving the SEO of the landing page where your infographic actually lives. This can be done by simply improving the on-page SEO, which includes image optimization.
In image optimization, you are pretty much-performing Image SEO. This is where you try to retain your infographics’ image’s digital quality and maximum resolution while decreasing the image size.
However, it would be best if you made sure that by reducing the image file size, the quality of the image remains unaffected.
This is known as image optimization, and it can improve your loading times, thus benefiting your SEO as search engines love faster-loading pages. Essay writers make sure that they offer services on websites that deliver outstanding loading time speeds and excellent customer service to go along with it.
Prominent Call-to-Action
If you really want to grab your users’ attention and bring in more traffic to your website, your infographic definitely needs to have a prominent call to actions.
Some of the best practices for CTAs include:
- You can implement CTAs that are both Above the Fold and Below the Fold; however, the latter has been given more preference lately.
- CTAs must stand out, and as such, they should include contrasting colors and features.
- It would help if you also considered using white space to separate your CTA from the rest of your text.
- CTAs become powerful with an emotional undertone or when connected to matters of urgency.
- To add more punch to your CTAs, you can use FOMO (Fear of Missing Out) to your advantage.
- Social Sharing
Social sharing is a powerful tool that can help your infographic to become viral, get indexed in the image search, and appear as a ranked result on SERPs (search engine result pages). The more people share your infographic across different platforms, the more revered it becomes and thus greatly boosts SEO.
Conclusion
Infographics are powerful tools that marketers can use to a great effect in order to capture the attention of visitors ad online users. With Infographics, you can leave a lasting impact on readers with the help of stunning visuals and amazing facts. Together they can be combined to deliver infotainment which is the combination of both entertainment and information.
I hope this post was able to offer you some meaningful insights as to how you can create the perfect infographic that can effectively boost the SEO of your business. For more questions regarding the topic, please feel free to leave a mention of your query in the comment section below. Cheers, and all the best for your future endeavors!
Author Bio
Stella Lincoln currently works as the Assistant Editor at Assignment Assistance and Master Thesis. She is quite fond of indulging herself in pop culture, including anime, movies, music, and video games. During her free time, she likes to doodle, create wall art, and practice mindful yoga.